Identification of Open Pit Mining Distribution over 20 years with Unsupervised Learning
Time Series Exploration with K-Means Clustering
Background
Simpangpesak’s geological landscape, characterized by its diverse rock formations and mineral deposits, has attracted attention from mining enthusiasts and industry experts alike. The region’s unique geology, coupled with the presence of tin-bearing ore bodies, laid the foundation for the establishment of open pit mining operations.
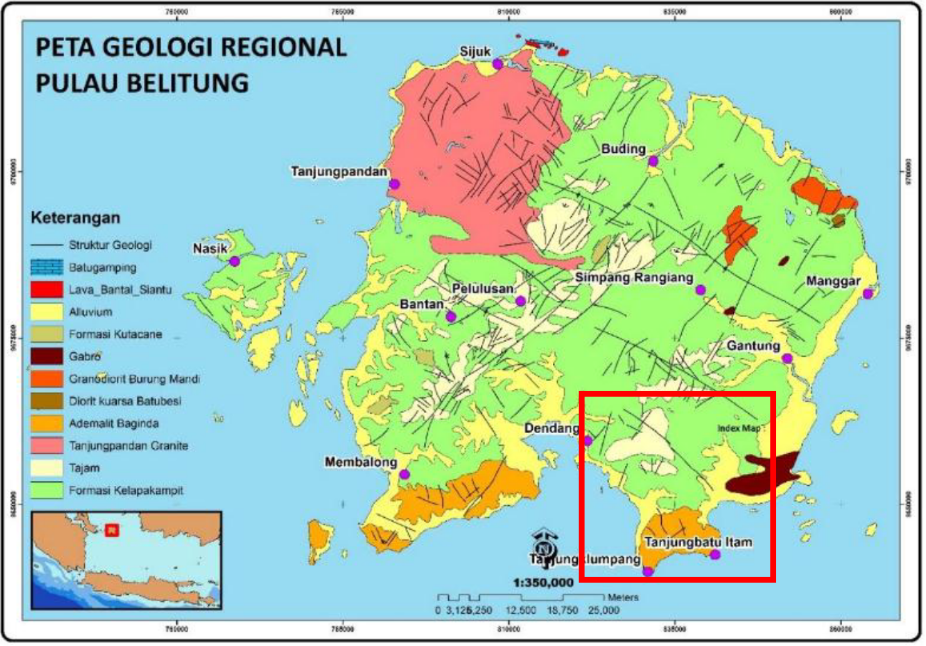 Geological Map of Belitung Area. The red square is area of interest: Simpangpesak.
The open pit mining operations in Simpangpesak have been a driving force behind the region’s economic growth. The extraction of tin, a vital component in various industrial applications, has stimulated job creation, infrastructure development, and increased revenue for local communities and government coffers. The economic impact extends beyond Simpangpesak, contributing to the global supply chain of tin.
While the economic benefits of open pit mining are evident, the industry has not been without its challenges, particularly in terms of environmental impact. Striking a balance between resource extraction and environmental preservation has been a priority. Sustainable mining practices, land reclamation efforts, and strict adherence to environmental regulations have been implemented to mitigate the ecological footprint of tin mining in Simpangpesak.
This research aims to investigate the distribution of open-pit tin mining expansion over the last 20 years using the k-means clustering approach. The utilization of the k-means clustering approach provides a quantitative and objective means to understand the geographical patterns of tin mining expansion, offering valuable insights into the evolution of this industry within the specified temporal scope.
Data and Method
Data
This study utilizes satellite imagery data from Landsat 5, covering the time span from 1998 to 2000 and 2008 to 2010, and Landsat 8 from 2019 to 2020. Landsat 5 data are specifically acquired using bands 1, 2, and 3, while Landsat 8 data utilize bands 2, 3, and 4. Both of these are natural combination bands.
Method
The research employs the k-means clustering algorithm as its primary methodological approach for the analysis of satellite imagery data. K-means clustering is a well-established technique used to partition spatial data into distinct groups or clusters based on spectral characteristics. By applying this algorithm to the selected bands and time intervals, the study aims to reveal patterns, concentrations, and clusters associated with open-pit tin mining expansion in the Simpangpesak region.
Results
Code
1
2
3
4
5
6
7
8
9
10
11
12
13
14
15
16
17
18
19
20
21
22
23
24
25
26
27
28
29
30
31
32
33
34
35
36
37
38
39
40
41
42
43
44
45
46
47
48
49
50
51
52
53
54
55
56
57
58
59
60
61
62
63
64
65
66
67
68
69
70
71
72
73
74
75
76
77
78
79
80
81
82
83
84
85
86
87
88
89
90
91
92
93
94
95
96
97
98
99
100
101
102
103
104
105
106
107
108
109
110
111
112
113
114
115
116
117
118
119
120
121
122
123
124
125
126
127
128
129
130
131
132
133
134
135
136
137
138
139
140
141
142
143
144
145
146
147
148
149
150
151
152
153
154
155
156
157
158
159
160
161
162
163
164
165
166
167
168
169
170
171
172
173
174
175
176
177
178
179
180
181
182
183
184
185
186
187
188
189
190
191
192
193
194
195
196
197
198
199
200
201
202
203
204
205
206
207
208
209
210
211
212
213
214
215
216
217
218
219
220
221
222
223
224
225
226
227
228
229
230
231
232
233
234
235
236
237
238
239
240
241
242
243
244
245
246
247
248
249
250
251
252
253
254
255
256
257
258
259
260
261
262
263
264
265
266
267
268
269
270
271
272
273
// AOI
var sp = ee.FeatureCollection("projects/ee-pryaarif011/assets/simpangpesak");

// Center the map on the AOI
Map.centerObject(sp, 12);

// Mask Landsat 8
var maskL8 = function(imageL8) {
  var qa = imageL8.select('BQA');
  var mask = qa.bitwiseAnd(1 << 4).eq(0);
  return imageL8.updateMask(mask);
}

// Mask Landsat 5
function maskL457sr(image) {
  // Bit 0 - Fill
  // Bit 1 - Dilated Cloud
  // Bit 2 - Unused
  // Bit 3 - Cloud
  // Bit 4 - Cloud Shadow
  var qaMask = image.select('QA_PIXEL').bitwiseAnd(parseInt('11111', 2)).eq(0);
  var saturationMask = image.select('QA_RADSAT').eq(0);

  // Apply the scaling factors to the appropriate bands.
  var opticalBands = image.select('SR_B.').multiply(0.0000275).add(-0.2);
  var thermalBand = image.select('ST_B6').multiply(0.00341802).add(149.0);

  // Replace the original bands with the scaled ones and apply the masks.
  return image.addBands(opticalBands, null, true)
      .addBands(thermalBand, null, true)
      .updateMask(qaMask)
      .updateMask(saturationMask);
}

// Landsat 8 data 2019-2020
// Temporal filtering
// Applying cloud masking function
// Applying median reducer
var image2020 = ee.ImageCollection('LANDSAT/LC08/C01/T1_TOA')
              .filterDate('2019-01-01', '2020-12-31')
              .map(maskL8)
              .median()
              .clip(sp);

// Landsat 5 data 1998-2000
var image2000 = ee.ImageCollection('LANDSAT/LT05/C02/T1_L2')
                     .filterDate('1998-01-01', '2000-01-01')
                     .map(maskL457sr)
                     .median()
                     .clip(sp);

// Landsat 5 data 2008-2010
var image2010 = ee.ImageCollection('LANDSAT/LT05/C02/T1_L2')
                     .filterDate('2008-01-01', '2010-01-01')
                     .map(maskL457sr)
                     .median()
                     .clip(sp);

// Use these bands.
// Landsat 8
var bands8 = ['B4', 'B3', 'B2'];
var natural2020 = image2020.select(bands8)

// Landsat 5
var bands5 = ['SR_B3', 'SR_B2', 'SR_B1'];
var natural2010 = image2010.select(bands5)
var natural2000 = image2000.select(bands5)

// Kmeans clustering
// Training data.
var training2020 = natural2020.sample({
  region: sp,
  scale: 30,
  numPixels: 5000
});

var training2010 = natural2010.sample({
  region: sp,
  scale: 30,
  numPixels: 5000
});

var training2000 = natural2000.sample({
  region: sp,
  scale: 30,
  numPixels: 5000
});

// Perform clustering with 5 classes.
var kmeans2020 = ee.Clusterer.wekaKMeans(5).train(training2020);
var kmeans2010 = ee.Clusterer.wekaKMeans(5).train(training2010);
var kmeans2000 = ee.Clusterer.wekaKMeans(5).train(training2000);

// Cluster the input using the trained clusterer.
var km2020 = image2020.cluster(kmeans2020);
var km2010 = image2010.cluster(kmeans2010);
var km2000 = image2000.cluster(kmeans2000);

// Function to calculate the percentage of each cluster
function calculateClusterPercentage(clusterLayer) {
  // Count the pixels in each cluster
  var clusterCounts = clusterLayer.select(['cluster']).reduceRegion({
    reducer: ee.Reducer.frequencyHistogram(),
    geometry: sp,
    scale: 30,
    maxPixels: 1e9
  });

  // Extract cluster counts from the dictionary
  var counts = ee.Dictionary(ee.Algorithms.If(clusterCounts.get('cluster'), clusterCounts.get('cluster'), {}));

  // Calculate the total pixel count in the AOI
  var totalPixels = sp.geometry().area().divide(900); // Assuming 30-meter resolution

  // Calculate the percentage of each cluster
  var clusterPercentages = {};
  for (var i = 0; i <= 4; i++) { // Assuming 5 clusters
    var clusterCount = ee.Number(counts.get(String(i), 0));
    var percentage = clusterCount.divide(totalPixels).multiply(100);
    clusterPercentages['Cluster ' + (i+1)] = percentage.getInfo();
  }

  return clusterPercentages;
}

// Calculate and print the percentage of clusters for KMeans 2020
var kmeans2020Percentages = calculateClusterPercentage(km2020);
print('Percentage of Clusters (KMeans 2020):', kmeans2020Percentages);

var kmeans2010Percentages = calculateClusterPercentage(km2010);
print('Percentage of Clusters (KMeans 2010):', kmeans2010Percentages);

var kmeans2000Percentages = calculateClusterPercentage(km2000);
print('Percentage of Clusters (KMeans 2000):', kmeans2000Percentages);

// Create a UI panel for the right sidebar.
var sidebar = ui.Panel({
  style: {width: '300px', position: 'bottom-right'}
});

// Function to remove all map layers
function removeAllLayers() {
  Map.layers().forEach(function(layer) {
    Map.layers().remove(layer);
  });
}

// Create a reset button
var resetButton = ui.Button({
  label: 'Reset Map',
  onClick: function() {
    removeAllLayers();
  }
});

// Add the reset button to the sidebar
sidebar.add(resetButton);

// Create a select dropdown for Natural layers.
var naturalSelect = ui.Select({
  items: ['Natural 2020', 'Natural 2010', 'Natural 2000'],
  placeholder: 'Select Natural Layer',
  onChange: function(selectedValue) {
    // Clear existing natural layers on the map.
    Map.layers().forEach(function(layer) {
      if (layer.getName().indexOf('Natural') !== -1) {
        Map.layers().remove(layer);
      }
    });

    // Add the selected natural layer to the map.
    if (selectedValue === 'Natural 2020') {
      Map.addLayer(natural2020, {max: 0.35}, 'Natural 2020');
    } else if (selectedValue === 'Natural 2010') {
      Map.addLayer(natural2010, {max: 0.35}, 'Natural 2010');
    } else if (selectedValue === 'Natural 2000') {
      Map.addLayer(natural2000, {max: 0.35}, 'Natural 2000');
    }
  }
});

// Add the select widget for Natural layers to the sidebar.
sidebar.add(ui.Label('Natural Layers'));
sidebar.add(naturalSelect);

// Custom colors for each cluster
var customClusterColors = ['blue', 'green', 'red', 'yellow', 'purple'];

// Declare a variable to hold the legend widget
var legendWidget;

// Function to add legend to the map
function addLegend(colors, names, dropdownWidth) {

  // Calculate the width of the legend based on the dropdown menu width
  var legendWidth = dropdownWidth;

  // Create a legend
  var legend = ui.Panel({
    style: {
      position: 'bottom-left',
      padding: '8px 15px',
      width: legendWidth + 'px'  // Set the width of the legend
    }
  });

  // Add title to the legend
  legend.add(ui.Label({
    value: 'K-Means Cluster',
    style: {fontWeight: 'bold', fontSize: '16px', margin: '0 0 8px 0'}
  }));

  // Add legend entries
  for (var i = 0; i < colors.length; i++) {
    var color = colors[i];
    var name = names[i];

    // Create the legend entry
    var entry = ui.Panel({
      style: { margin: '0 0 5px 0', fontSize: '14px', fontWeight: 'bold', padding: '8px' },
      layout: ui.Panel.Layout.Flow('horizontal')
    });

    // Add color box to the entry
    entry.add(ui.Label({ style: { backgroundColor: color, padding: '8px', margin: '0 0 0 4px' } }));

    // Add name to the entry
    entry.add(ui.Label({ value: name }));

    // Add the entry to the legend
    legend.add(entry);
  }

  // Add the legend to the map
  legendWidget = ui.Panel({
    widgets: [legend],
    style: { position: 'bottom-left' }
  });

  Map.add(legendWidget);
}

addLegend(customClusterColors, ['Cluster 1', 'Cluster 2', 'Cluster 3', 'Cluster 4', 'Cluster 5']);

// Create a select dropdown for KMeans layers.
var kmeansSelect = ui.Select({
  items: ['KMeans 2020', 'KMeans 2010', 'KMeans 2000'],
  placeholder: 'Select KMeans Layer',
  onChange: function(selectedValue) {
    // Clear existing KMeans layers on the map.
    Map.layers().forEach(function(layer) {
      if (layer.getName().indexOf('KMeans') !== -1) {
        Map.layers().remove(layer);
      }
    });

    if (selectedValue === 'KMeans 2020') {
      Map.addLayer(km2020, {palette: customClusterColors, min: 0, max: 4}, 'KMeans 2020');
    } else if (selectedValue === 'KMeans 2010') {
      Map.addLayer(km2010, {palette: customClusterColors, min: 0, max: 4}, 'KMeans 2010');
    } else if (selectedValue === 'KMeans 2000') {
      Map.addLayer(km2000, {palette: customClusterColors, min: 0, max: 4}, 'KMeans 2000');
    }
  }
});

// Add the select widget for KMeans layers to the sidebar.
sidebar.add(ui.Label('KMeans Layers'));
sidebar.add(kmeansSelect);

// Add the sidebar to the map.
Map.add(sidebar);
This is the link to UI that created from Google Earth Engine
below is image slider from each years of analysis:
- 1998-2000
Percentage of each cluster in the year 2000
| Cluster | Area (%) |
|---|---|
| 1 | 10.93 |
| 2 | 0.92 |
| 3 | 2.59 |
| 4 | 37.40 |
| 5 | 48.51 |
- 2008-2010
Percentage of each cluster in the year 2010
| Cluster | Area (%) |
|---|---|
| 1 | 4.24 |
| 2 | 1.34 |
| 3 | 51.48 |
| 4 | 11.32 |
| 5 | 31.98 |
- 2019-2020
Percentage of each cluster in the year 2020
| Cluster | Area (%) |
|---|---|
| 1 | 27.66 |
| 2 | 2.01 |
| 3 | 10.69 |
| 4 | 5.45 |
| 5 | 54.54 |
Interpretation
In general, on Landsat natural band images, it is evident that the tin mining area in the Simpangpesak sub-district is increasing each year. K-Means Clustering analysis indicates that in the year 2000, this open-pit mining area was in 2 clusters: Cluster 2 and 3, totaling 3.9% of the total area. In 2010, the analysis shows that the open-pit mining area is in 2 clusters: Cluster 1 and 2, totaling 5.58% of the total area. Meanwhile, in 2020, the analysis indicates that the open-pit mining area is in 3 clusters: Cluster 2, 3, and 4, totaling 18.15% of the total area.