ArcGIS for Enhancing Water Utility Network in Tigaraksa
Engage in Exploration of Water Utility Network Data to Gain Deep Insight and Understanding
Introduction
What we do?
- Engage in exploration of water utility network data to gain deep insight and understanding.
- Performing network analysis using ArcGIS Utility Network.
- Performing advanced analysis on water utility data using statistical approaches.
Objectives
Gain comprehensive understanding and practical experience in handling utility network, with a specific focus on ArcGIS Utility Network.
Use Case: Tigaraksa
Tigaraksa is a district located in Banten Province, Indonesia. Tigaraksa is an urban area located on the edge of Tangerang Regency.
Why Tigaraksa?
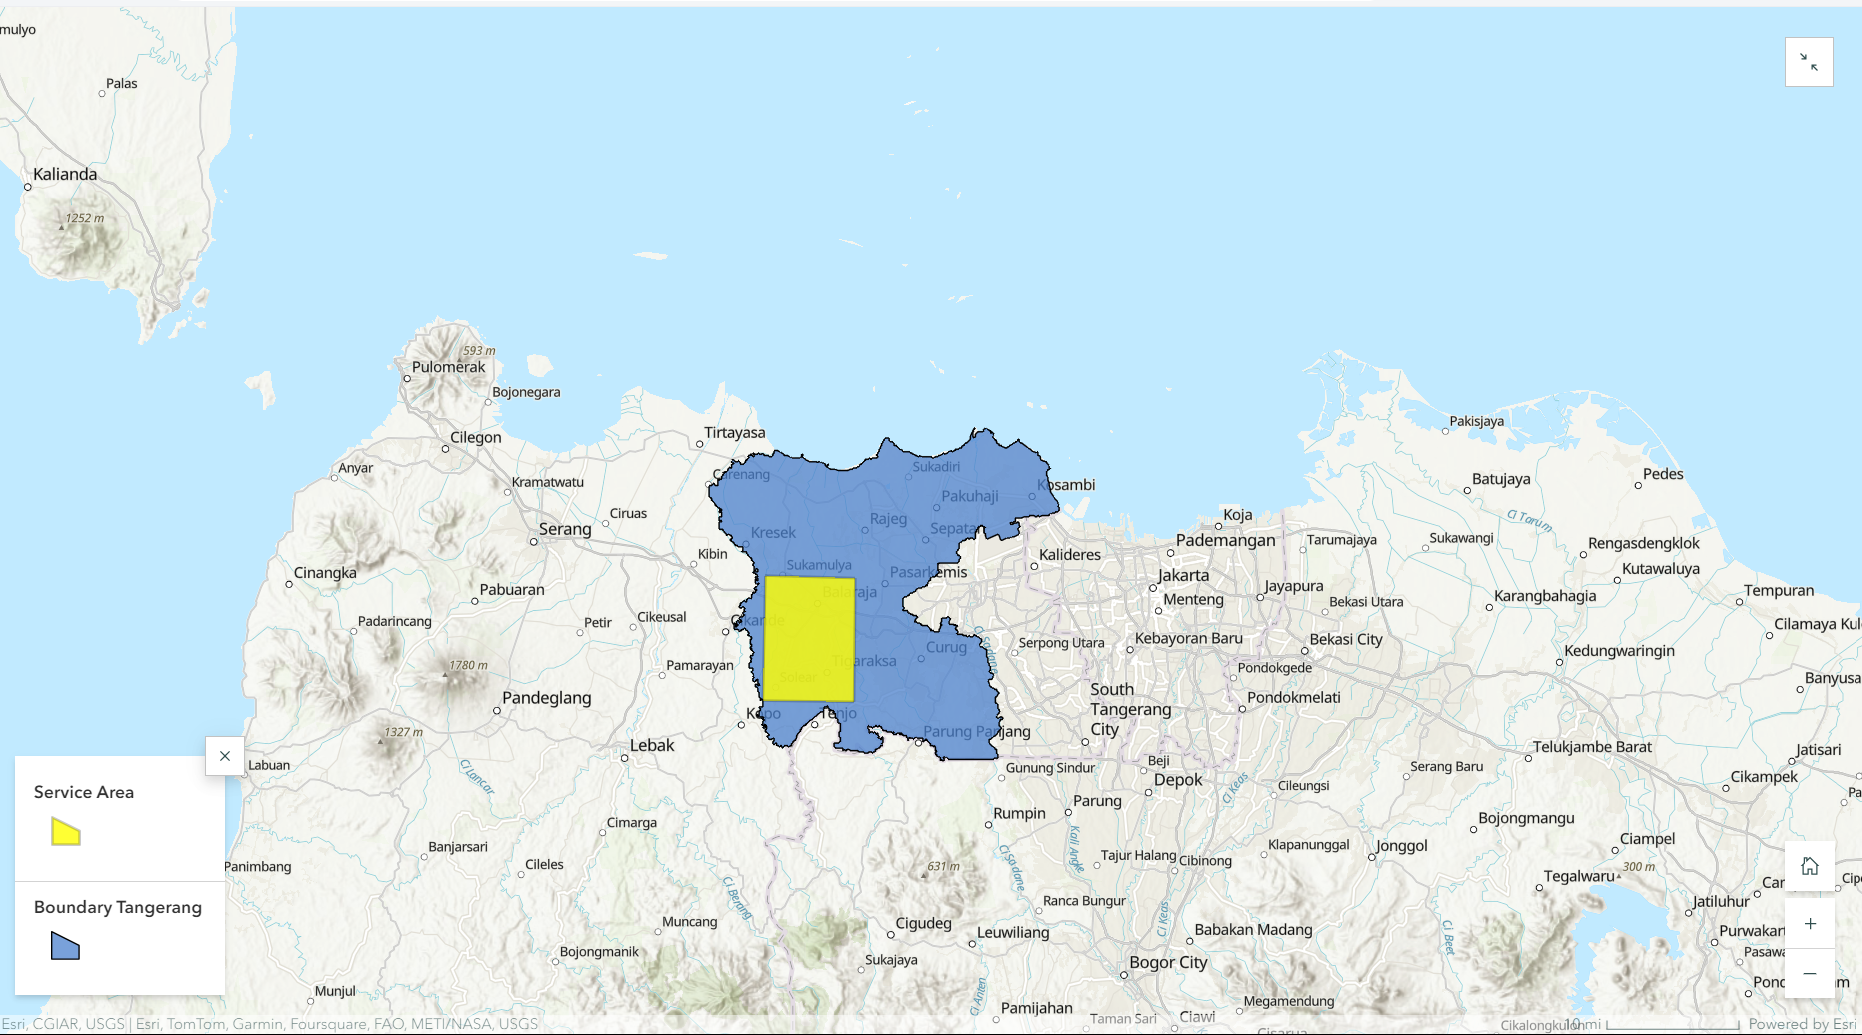
- The development in Tigaraksa makes it easily accessible and strategically important for the local community.
- The area is classified as having a tropical rainforest climate.
- Geological assessments reveal that the area comprises three rock formations unsuitable for serving as an aquifer.
Methodology
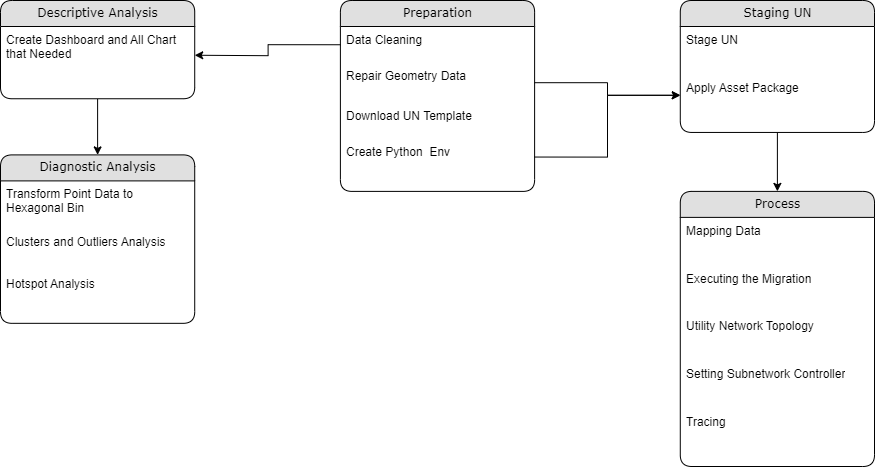 Workflows.
Supporting Videos will be Uploaded soon
Modernizing Network Management with Utility Network
Managing Asset vs Asset Management
Both of these sentences may appear similar, but in reality, they carry different meanings.
| Managing Assets | Asset Management |
|---|---|
| Lifecycle activities and asset care - availability, realibility, dependability, and safety | The Purpose of your organization and what asset does it need and why |
| Asset location, condition, life extension and/or interventions | Value, purpose and long term outcomes |
| Asset databases, systems and performances | Risk and context e.g. markets / climate / regulation |
Utility Network Itself
Utility network is a specialized type of network model used in GIS to represent and analyze complex systems of interconnected utility infrastructure, such as water,electricity, and telecommunications networks. It provides a comprehensive framework for managing and visualizing the physical and logical relationships between network elements, such as pipes, cables, substations, and junctions.
ArcGIS Utility Network
ArcGIS Utility Network, developed by Esri, is a powerful tool for managing and analyzing utility networks such as water, electricity, and telecommunications. It helps utilities represent their assets in detail and interconnectedly, facilitating precise spatial analysis and visualization
Repair Geometry in Local Dataset
Repairing geometry in a local dataset is a critical process within a utility network. This process involves cleansing geometric or attribute error using topology. When errors are identified, edit the features causing the errors like:
- Extend Line tool to fix undershoots
- Trim Line tool to fix overlaps
- Snap tool to connect features properly.
Staging Utility Network
Staging utility network involves two stages:
- Stage Utility Network» prepare the utility network for deployment by creating a staged version that encapsulates all the necessary configurations and components.
- Applying Asset Package» define the schema and properties of a utility network by applying a domain network and structure network to a staged utility network.
Utility Network Data Migration
Data migration involves two stages:
Create Data Loading Workspace» to establish a workspace for loading and importing data into the Utility Network. Then, edit an Excel file following specific guidelines to ensure accurate formatting and alignment with the required schema and attributes in the Utility Network.
Execute Data Load» define the schema and properties of a utility network by applying0 a domain network and structure network to a staged utility network.
Network Topology
Network topology ensure the integrity and accuracy of the utility network data by resolving errors and enhancing the overall functionality and reliability of the network.
Tracing: Connected
Tracing helps utilities and organizations understand how assets are interconnected and how they may be affected by network events or issues. Connected trace type in a utility network provides:
- The ability to trace and analyze the network based on connectivity rules.
- This trace type follows the connected paths between network features, allowing users to determine the relationships and dependencies between assets.
Tracing: Subnetwork Controller
Subnetwork Controller involves managing and supervising sub-networks within the utility network infrastructure.
Purpose: Knowing that the customer connects to the DMA meter system.
Tracing: Upstream
Upstream tracing involves tracking the flow of water from a service meter back to its original source within the network.
Purpose: Identifying the source of a leak in water pipes or the point from which water is supplied to a specific location within the network.
Tracing: Downstream
Downstream tracing involves tracking the flow of water from the original source to the service meter within the network.
Purpose: Identifying how a leak in a waterway will affect downstream areas or how a fault in a transformer will affect the water network.
Tracing: Isolation
Tracing isolation focuses on separating isolated parts of the network from specific valve.
Purpose: To find out the valve from the customer so that if there is a leak from the customer, you know which valve is closed so that the leak can be repaired.
Transforming Data to Unraveling Its Hidden Patterns
Learning how to leverage the power of Insights for ArcGIS could make the difference between throwing a dart while blindfolded to land on your strategy and taking purposeful aim.
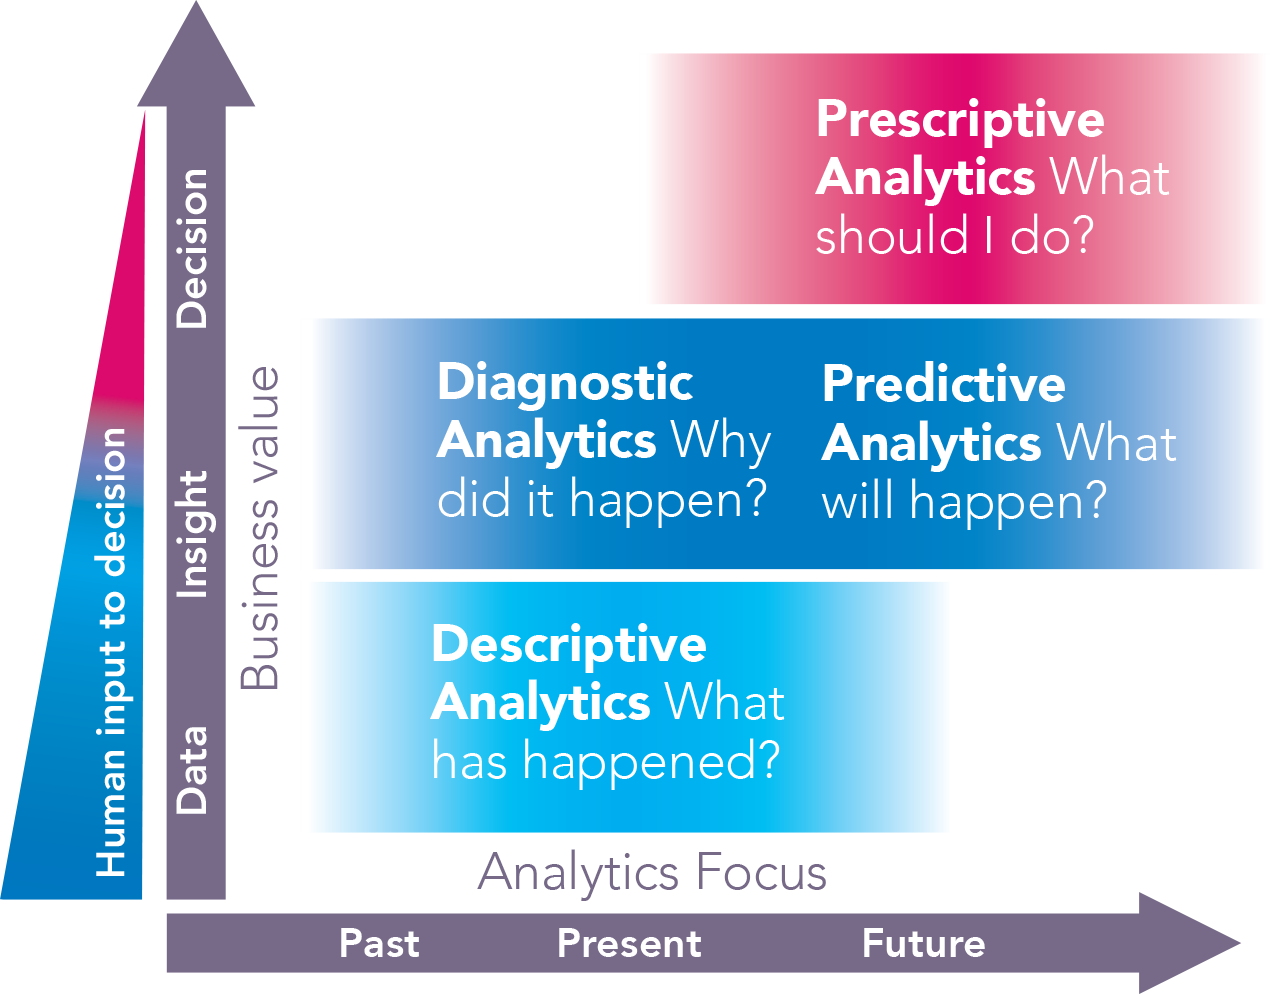 Kind of Analysis.
Descriptive Analytics for Water Arrears
For this analysis, only 4 variables can be used: Number of Arrears, Amount of Arrears, Bills, & Cubications. The visualization of data through graphs and charts condenses big data into smaller more useful nuggets. These are accomplished with ArcGIS Map Viewer and ArcGIS Dashboard.
Diagnostic Analytics
- Find spatial patterns/clusters in the data that are not visible from descriptive analysis
- For the sake of visualizing, point data will be transformed into hexagonal bin with 100m radius with Aggregate Points in GeoAnalytics Desktop Tool .
Hotspot Analysis
- Identifies statistically significant hot spots and cold spots using the Getis-Ord Gi* statistic.
- The Gi* statistic returned for each feature in the dataset is a z-score. For statistically significant positive z-scores, the larger the z-score is, the more intense the clustering of high values (hot spot). For statistically significant negative z-scores, the smaller the z-score is, the more intense the clustering of low values (cold spot).
- There are several clusters that form in all variables -> Some places have a tendency to be clustered, either higher or lower value than other places.
- These are accomplished with Hotspot Analysis (Getis-Ord GI*) from Spatials Analysis Tools
Clusters and Outliers Analysis
- Indentifies statistically significant hot spots, cold spots, and spatial outliers using the Anselin Local Moran’s I statistic.
- Determine clusters of statistically significant positive or negative z-scores, but also indicate if the feature has a high value and is surrounded by features with low values or if the feature has a low value and is surrounded by features with high values as outliers.
- While there are several clusters that form in all variables, outliers can still be found in each cluster. - These are accomplished with Cluster and Outlier Analysis (Anselin Local Moran’s I) from Spatials Analysis Tools.
Summary
- The potential for modernizing Tigaraksa’s pipeline management through the implementation of ArcGIS Utility Network solutions, showcasing the transformative capabilities of this technology in network management practices.
- The data component illustrated in local dataset can affect the data migration process using Utility Network, so the completeness of data assets needs to be considered.
- Advanced analysis using ArcGIS technology facilitates data transformation to unravel its pattern.